Estimating Cuba’s 2021–2026 population collapse
Author: Yasset Pérez-Riverol (@ypriverol)
An open, reproducible companion to the demographics study in the CubaScience hub. The earlier bibliometrics paper is arXiv:2007.09638 (Trends in Cuban research output: publications and patents).
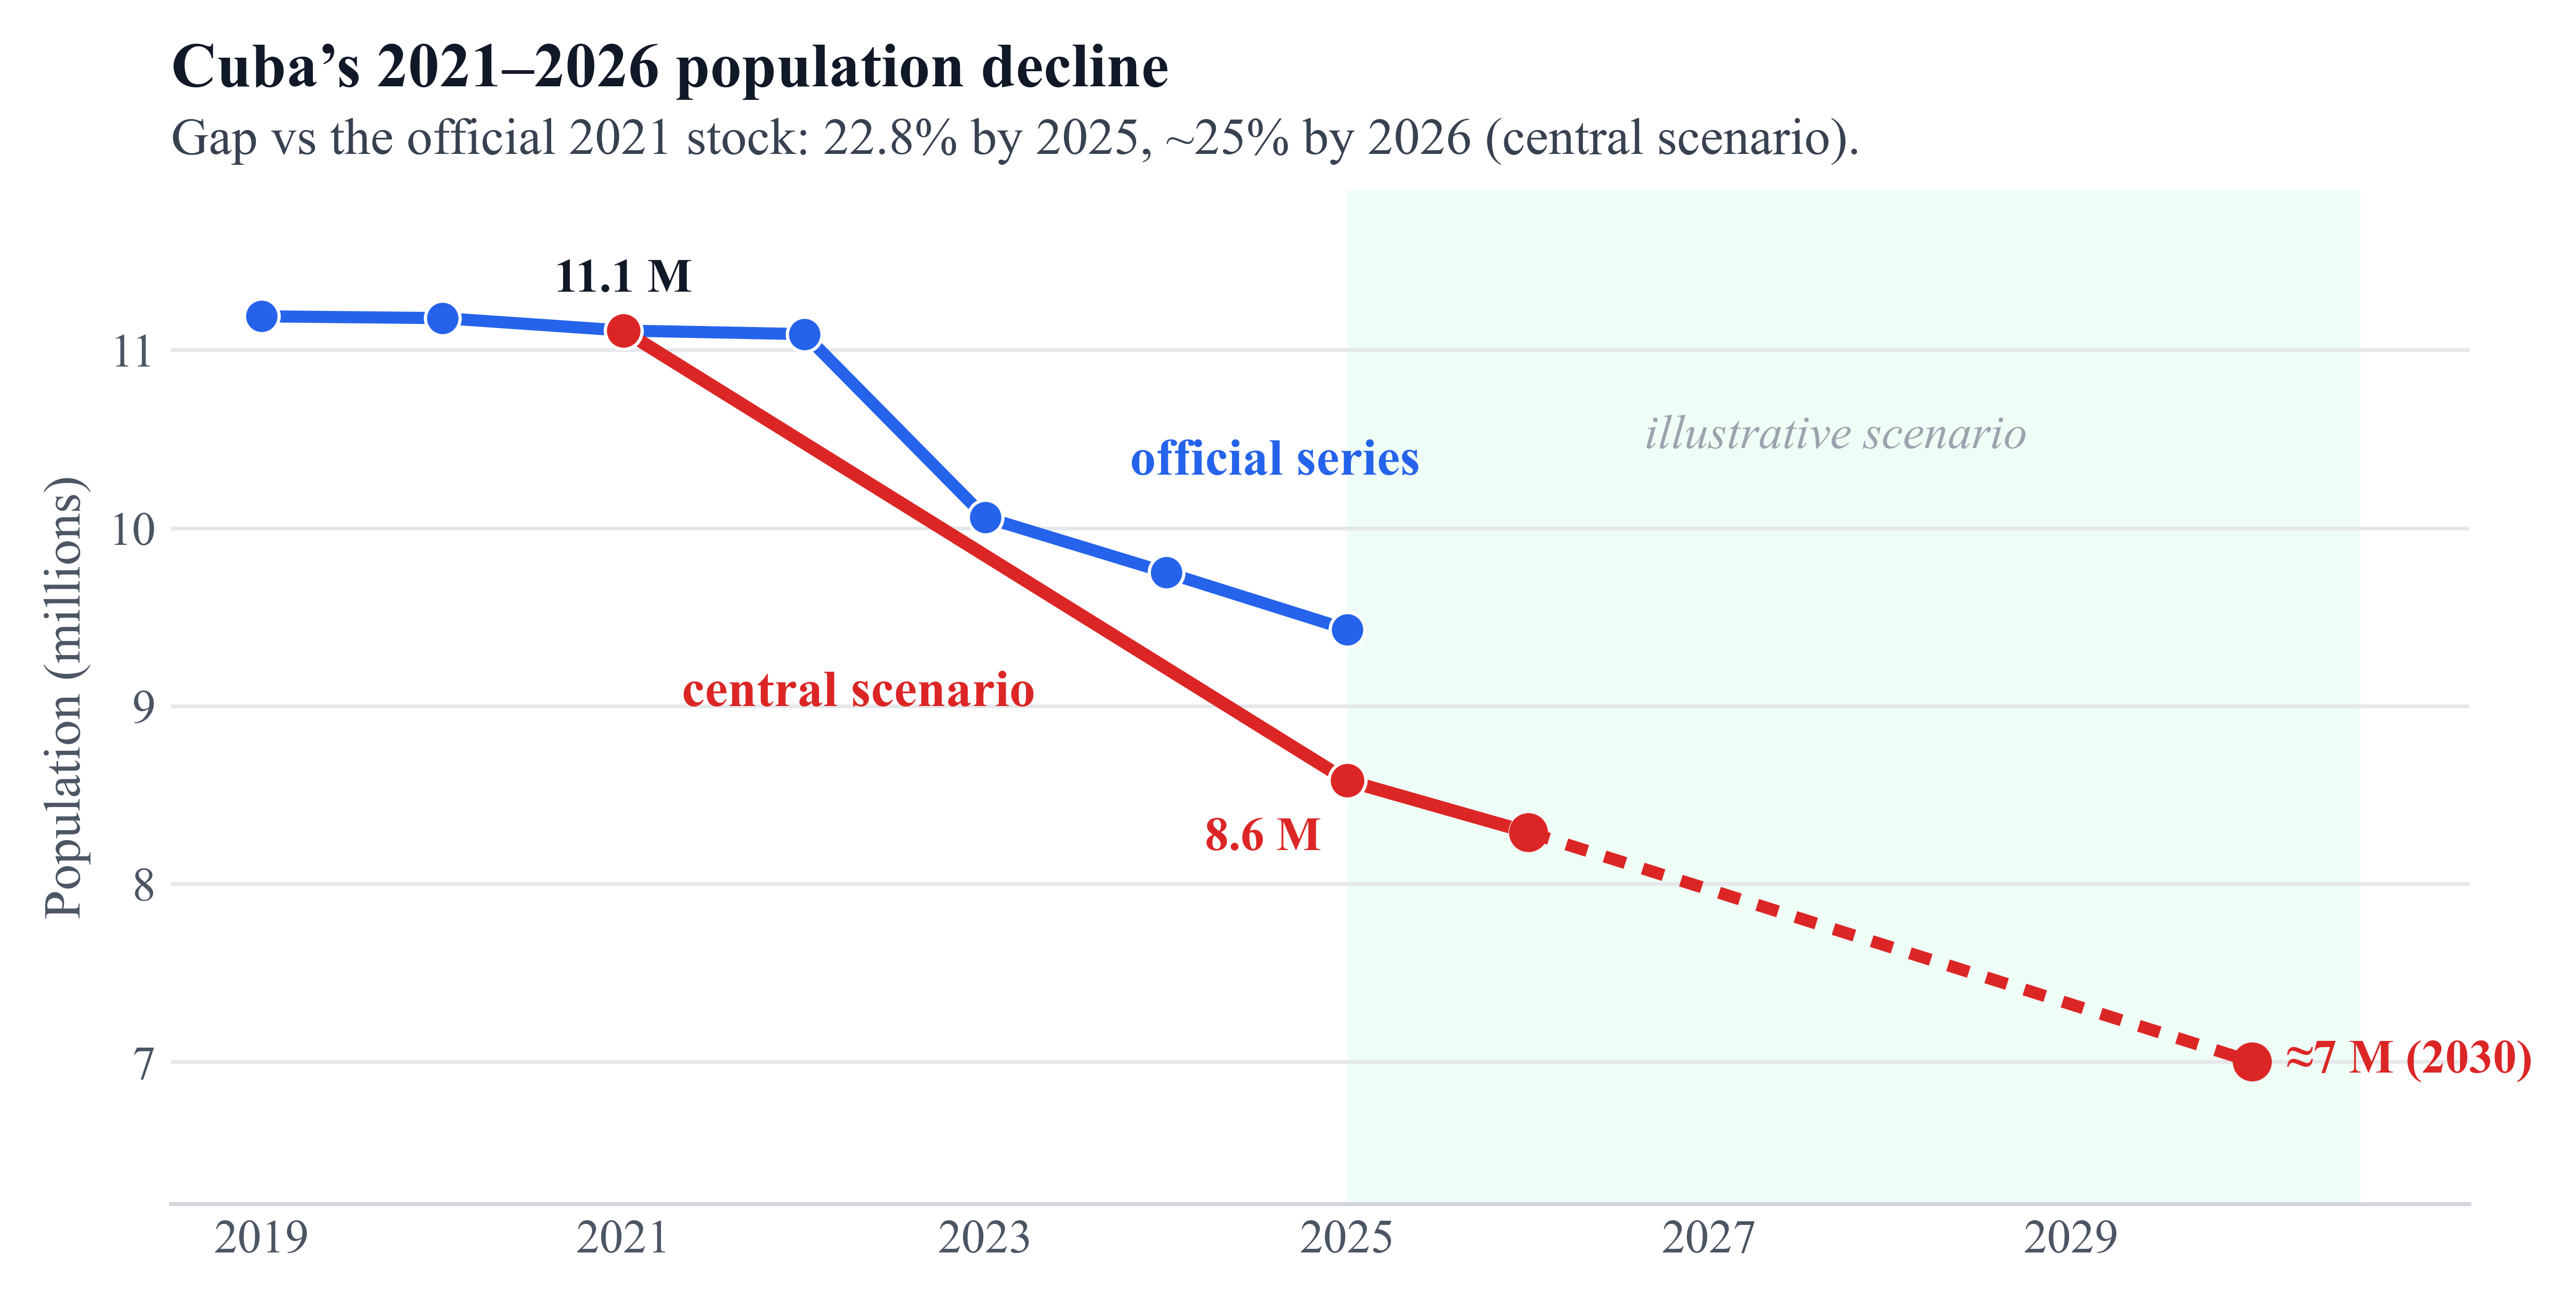
Central finding. This is not emigration alone. It is a dual engine: young people leave and, at the same time, fewer children are born and more older adults die. The official ONEI headcount no longer matches who actually lives on the island. By end-2025, preferred central scenario places the living population near 8.58 million (≈ −2.53 million, 22.8% on the official end-2021 base).
Citation (preprint / forthcoming DOI): Pérez-Riverol, Y. (2026). Estimating Cuba’s 2021–2026 population collapse. Monte Carlo estimation and triangulation of independent records. Zenodo (DOI forthcoming).
License: Content CC0 1.0 · Code under the repository license (CC0 1.0).
import sys
from pathlib import Path

import numpy as np
import pandas as pd

ROOT = Path.cwd()
if not (ROOT / "scripts" / "notebook_support.py").exists():
    if (ROOT / "demographics" / "scripts" / "notebook_support.py").exists():
        ROOT = ROOT / "demographics"
    elif (ROOT.parent / "scripts" / "notebook_support.py").exists():
        ROOT = ROOT.parent
sys.path.insert(0, str(ROOT / "scripts"))

from notebook_support import (
    ANCHORS,
    MODEL_SUMMARY,
    TRIANGULATION,
    run_model_a,
    summarize,
)

FIG = ROOT / "figures"
pd.set_option("display.float_format", lambda x: f"{x:,.2f}")
print("Project root:", ROOT)
Project root: /Users/yperez/work/cubascience/demographics
Abstract
We estimate Cuba's population decline from end-2021 to end-2025 with the demographic accounting identity
$$P_{\\mathrm{end}} = P_{\\mathrm{start}} + \\mathrm{births} - \\mathrm{deaths} - \\mathrm{net\\ migration}$$
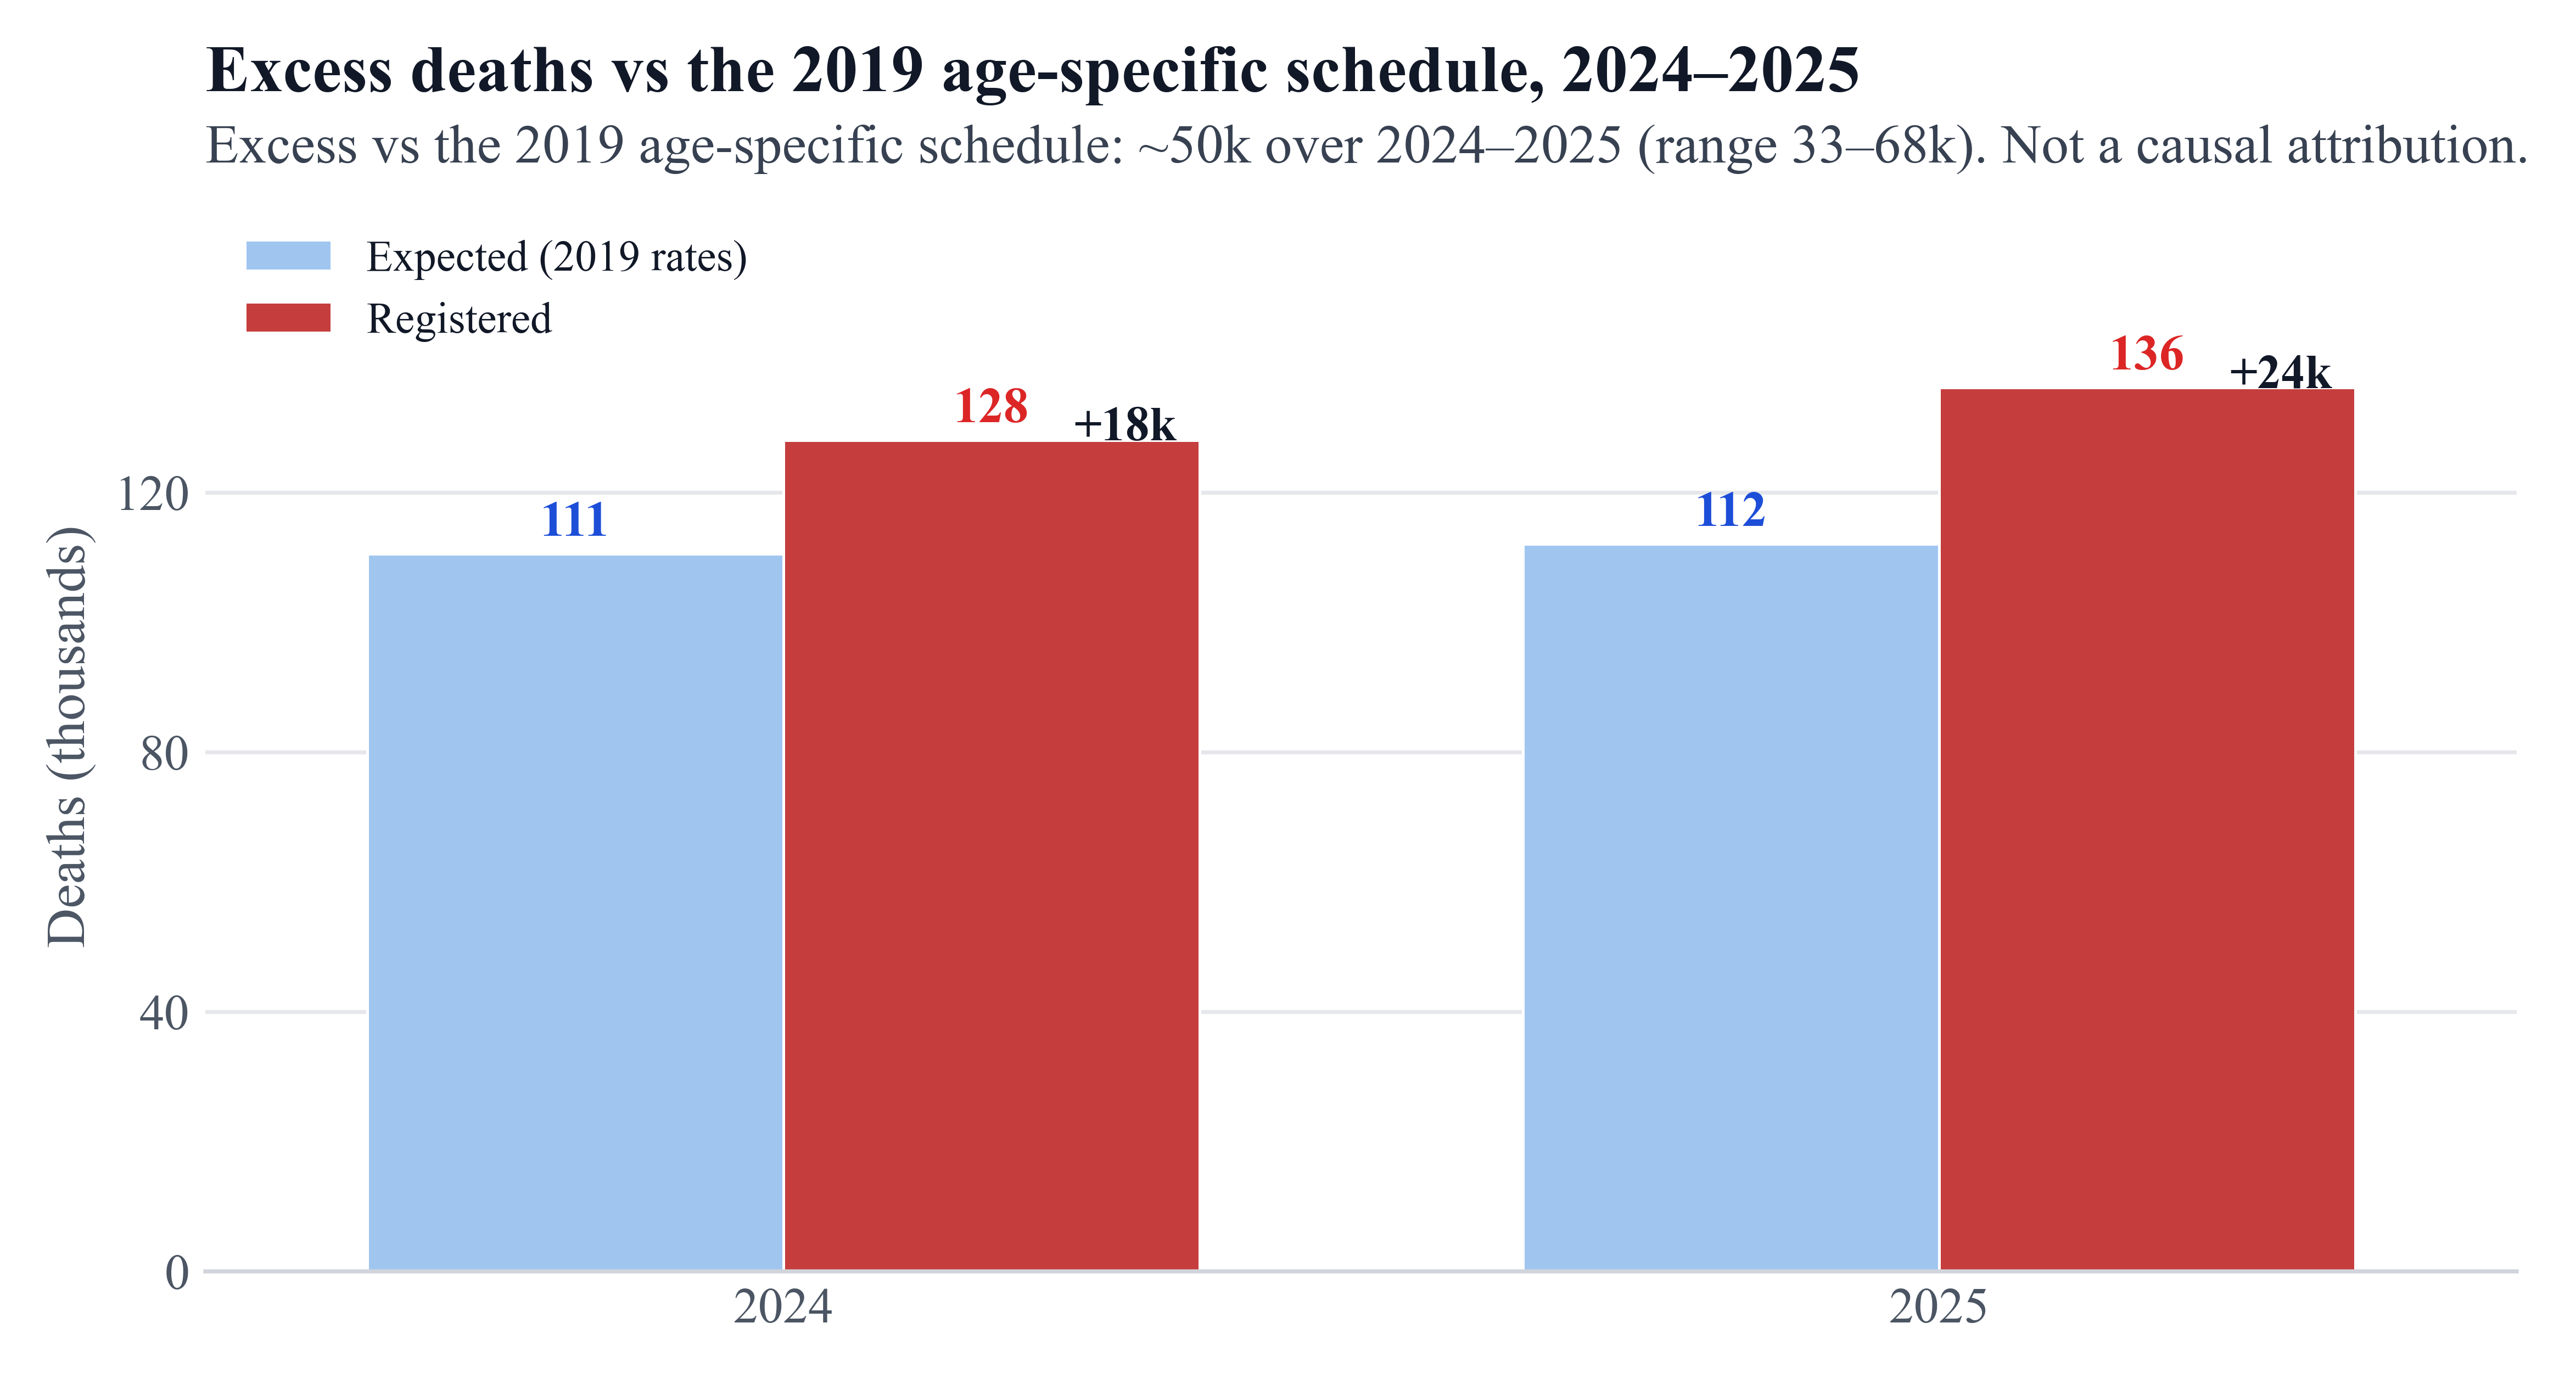
using Monte Carlo simulation (four scenarios) and triangulation against independent administrative registers. Preferred central scenario (infant-mortality sentinel) converges near 8.58 M. Emigration explains most of the loss (~92%); age-standardized excess mortality in 2024–2025 is about 50 thousand (32.6–67.5k) deaths. We project continued decline through end-2026.
Anchor indicators
anchor_df = pd.DataFrame(
    [
        ("Real population (end-2025, central scenario)", f"≈ {ANCHORS['population_end_2025_model_d_m']:.2f} M"),
        ("Loss vs 2021", f"≈ {ANCHORS['loss_vs_2021_m']:.2f} M (−{ANCHORS['loss_vs_2021_pct']}%)"),
        ("Births 2025", f"{ANCHORS['births_2025']:,}"),
        ("Deaths 2025", f"{ANCHORS['deaths_2025']:,}"),
        ("Natural balance 2025", f"{ANCHORS['natural_balance_2025']:,}"),
        ("Total fertility rate 2025", f"{ANCHORS['tfr_2025']} (replacement 2.1)"),
        ("Share aged 60+", f"{ANCHORS['pct_age_60_plus']}% (median age {ANCHORS['median_age']})"),
        ("Excess deaths 2024–25 (age-adj.)", f"≈ {ANCHORS['excess_deaths_2024_25_low']:,}–{ANCHORS['excess_deaths_2024_25_high']:,}"),
        ("ONEI official end-2025", f"{ANCHORS['onei_end_2025']:,}"),
    ],
    columns=["Indicator", "Value"],
)
anchor_df
| Indicator | Value | |
|---|---|---|
| 0 | Real population (end-2025, central scenario) | ≈ 8.58 M |
| 1 | Loss vs 2021 | ≈ 2.53 M (−22.8%) |
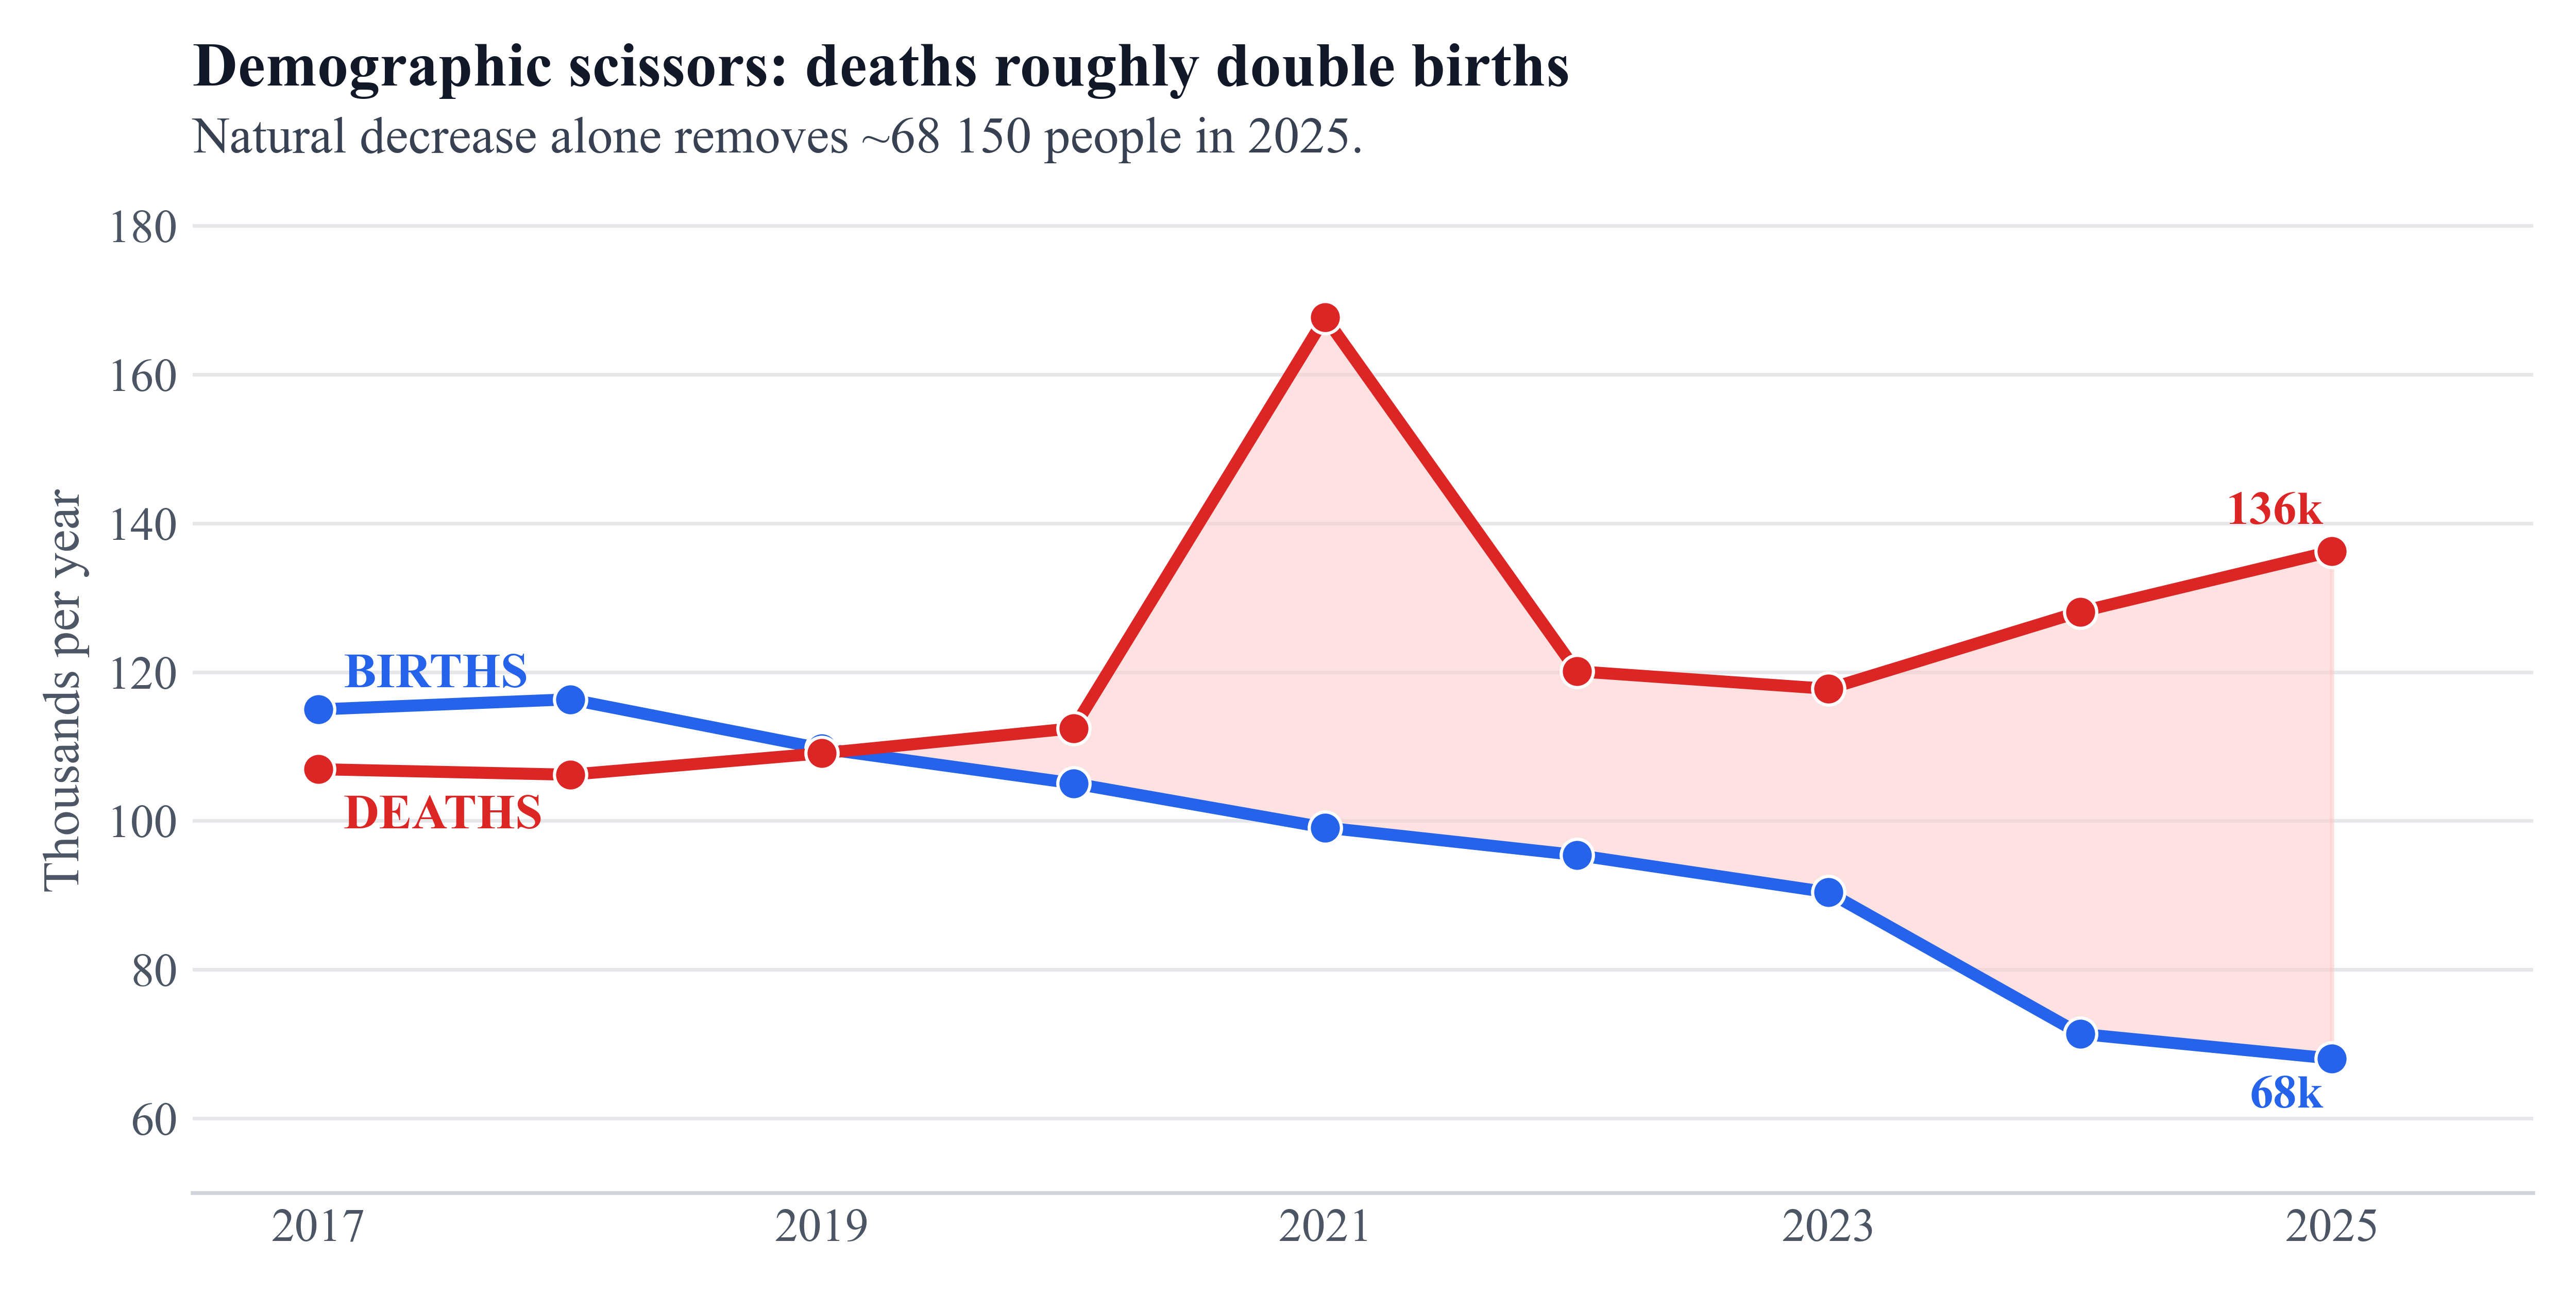
| 2 | Births 2025 | 68,064 |
| 3 | Deaths 2025 | 136,214 |
| 4 | Natural balance 2025 | -68,150 |
| 5 | Total fertility rate 2025 | 1.29 (replacement 2.1) |
| 6 | Share aged 60+ | 26.7% (median age 45.0) |
| 7 | Excess deaths 2024–25 (age-adj.) | ≈ 32,557–67,507 |
| 8 | ONEI official end-2025 | 9,434,593 |
1. Three versions of the truth
Any estimate must start from an uncomfortable fact: three mutually inconsistent population series exist for Cuba.
- UN (~10.9 M in 2025): World Population Prospects still assumes net emigration of only ~22k/year — wrong by roughly an order of magnitude.
- ONEI (9.43 M end-2025): after a major downward revision recognizing >1 M emigrants in 2022–2023, then further annual drops.
- Independent (~8.0–8.6 M): Albizu-Campos and related work using electoral rolls and arrival data.
The honest range for recent years spans almost 3 million people — itself an indictment of the missing census (last completed in 2012).
2. Accounting identity: births, deaths, migration
Population change has only three terms. All three moved against Cuba at once. Deaths already roughly double births ("the scissors"). Emigration dominates the absolute loss, but the internal engine (fertility collapse + elevated mortality + aging) reshapes who remains.
3. Four Monte Carlo models
We convert disagreement into interval estimates. Within each model we report prior-predictive spreads, which are NOT confidence intervals and have no coverage property; across models the spread is structural uncertainty (1.97–2.79 M) and must not be confused with a CI.
central scenario is preferred: infant mortality is among the few yearly metrics Cuba records carefully. An elasticity ≈0.30 transfers the IMR signal to all-cause mortality; the predicted rise matches the registered CDR rise, arguing against huge hidden death totals and locating the open question in migration, not deaths.
Note: infant mortality is ~9.9 per thousand (~1%), not "10%". The story is the ~39% year-on-year jump (2024→2025), not a 10% level.
models = pd.DataFrame(
    MODEL_SUMMARY,
    columns=["Model", "Assumption", "Decline (M)", "Decline (%)", "Pop. end-2025 (M)"],
)
models
| Model | Assumption | Decline (M) | Decline (%) | Pop. end-2025 (M) | |
|---|---|---|---|---|---|
| 0 | Null: ONEI at face value (U0=0, M=1, Dfac=1) | Reproduces ONEI's published figure exactly, by... | 1.68 | 15.10 | 9.43 |
| 1 | Conservative (not an ONEI-consistent floor: me... | 1.97 | 17.80 | 9.14 | |
| 2 | Crisis-adjusted central | 2.53 | 22.80 | 8.58 | |
| 3 | Upper stress | 2.79 | 25.10 | 8.32 |
Lightweight Model A replay
The paper uses $N = 10^6$ draws. Below we run a smaller sample for interactive speed; medians should be close.
N = 100_000  # paper: 1_000_000
draws = run_model_a(n=N)
for label, key in [
    ("Absolute decline 2019→2025", "decline"),
    ("Percent decline", "pct"),
    ("Population end-2025", "p2025"),
    ("Net emigration 2020–25", "mig"),
]:
    s = summarize(draws[key])
    if key == "pct":
        print(f"{label}: median {s['median']:.1f}% | 90% prior-predictive spread (not a confidence interval) [{s['p05']:.1f}, {s['p95']:.1f}]")
    else:
        print(f"{label}: median {s['median']:,.0f} | 90% prior-predictive spread (not a confidence interval) [{s['p05']:,.0f}, {s['p95']:,.0f}]")
Absolute decline 2019→2025: median 1,959,645 | 90% prior-predictive spread (not a confidence interval) [1,790,990, 2,201,827]
Percent decline: median 17.6% | 90% prior-predictive spread (not a confidence interval) [16.1, 19.8]
Population end-2025: median 9,153,570 | 90% prior-predictive spread (not a confidence interval) [8,911,388, 9,322,225]
Net emigration 2020–25: median 1,635,191 | 90% prior-predictive spread (not a confidence interval) [1,635,191, 1,635,191]
4. Triangulation of the real population
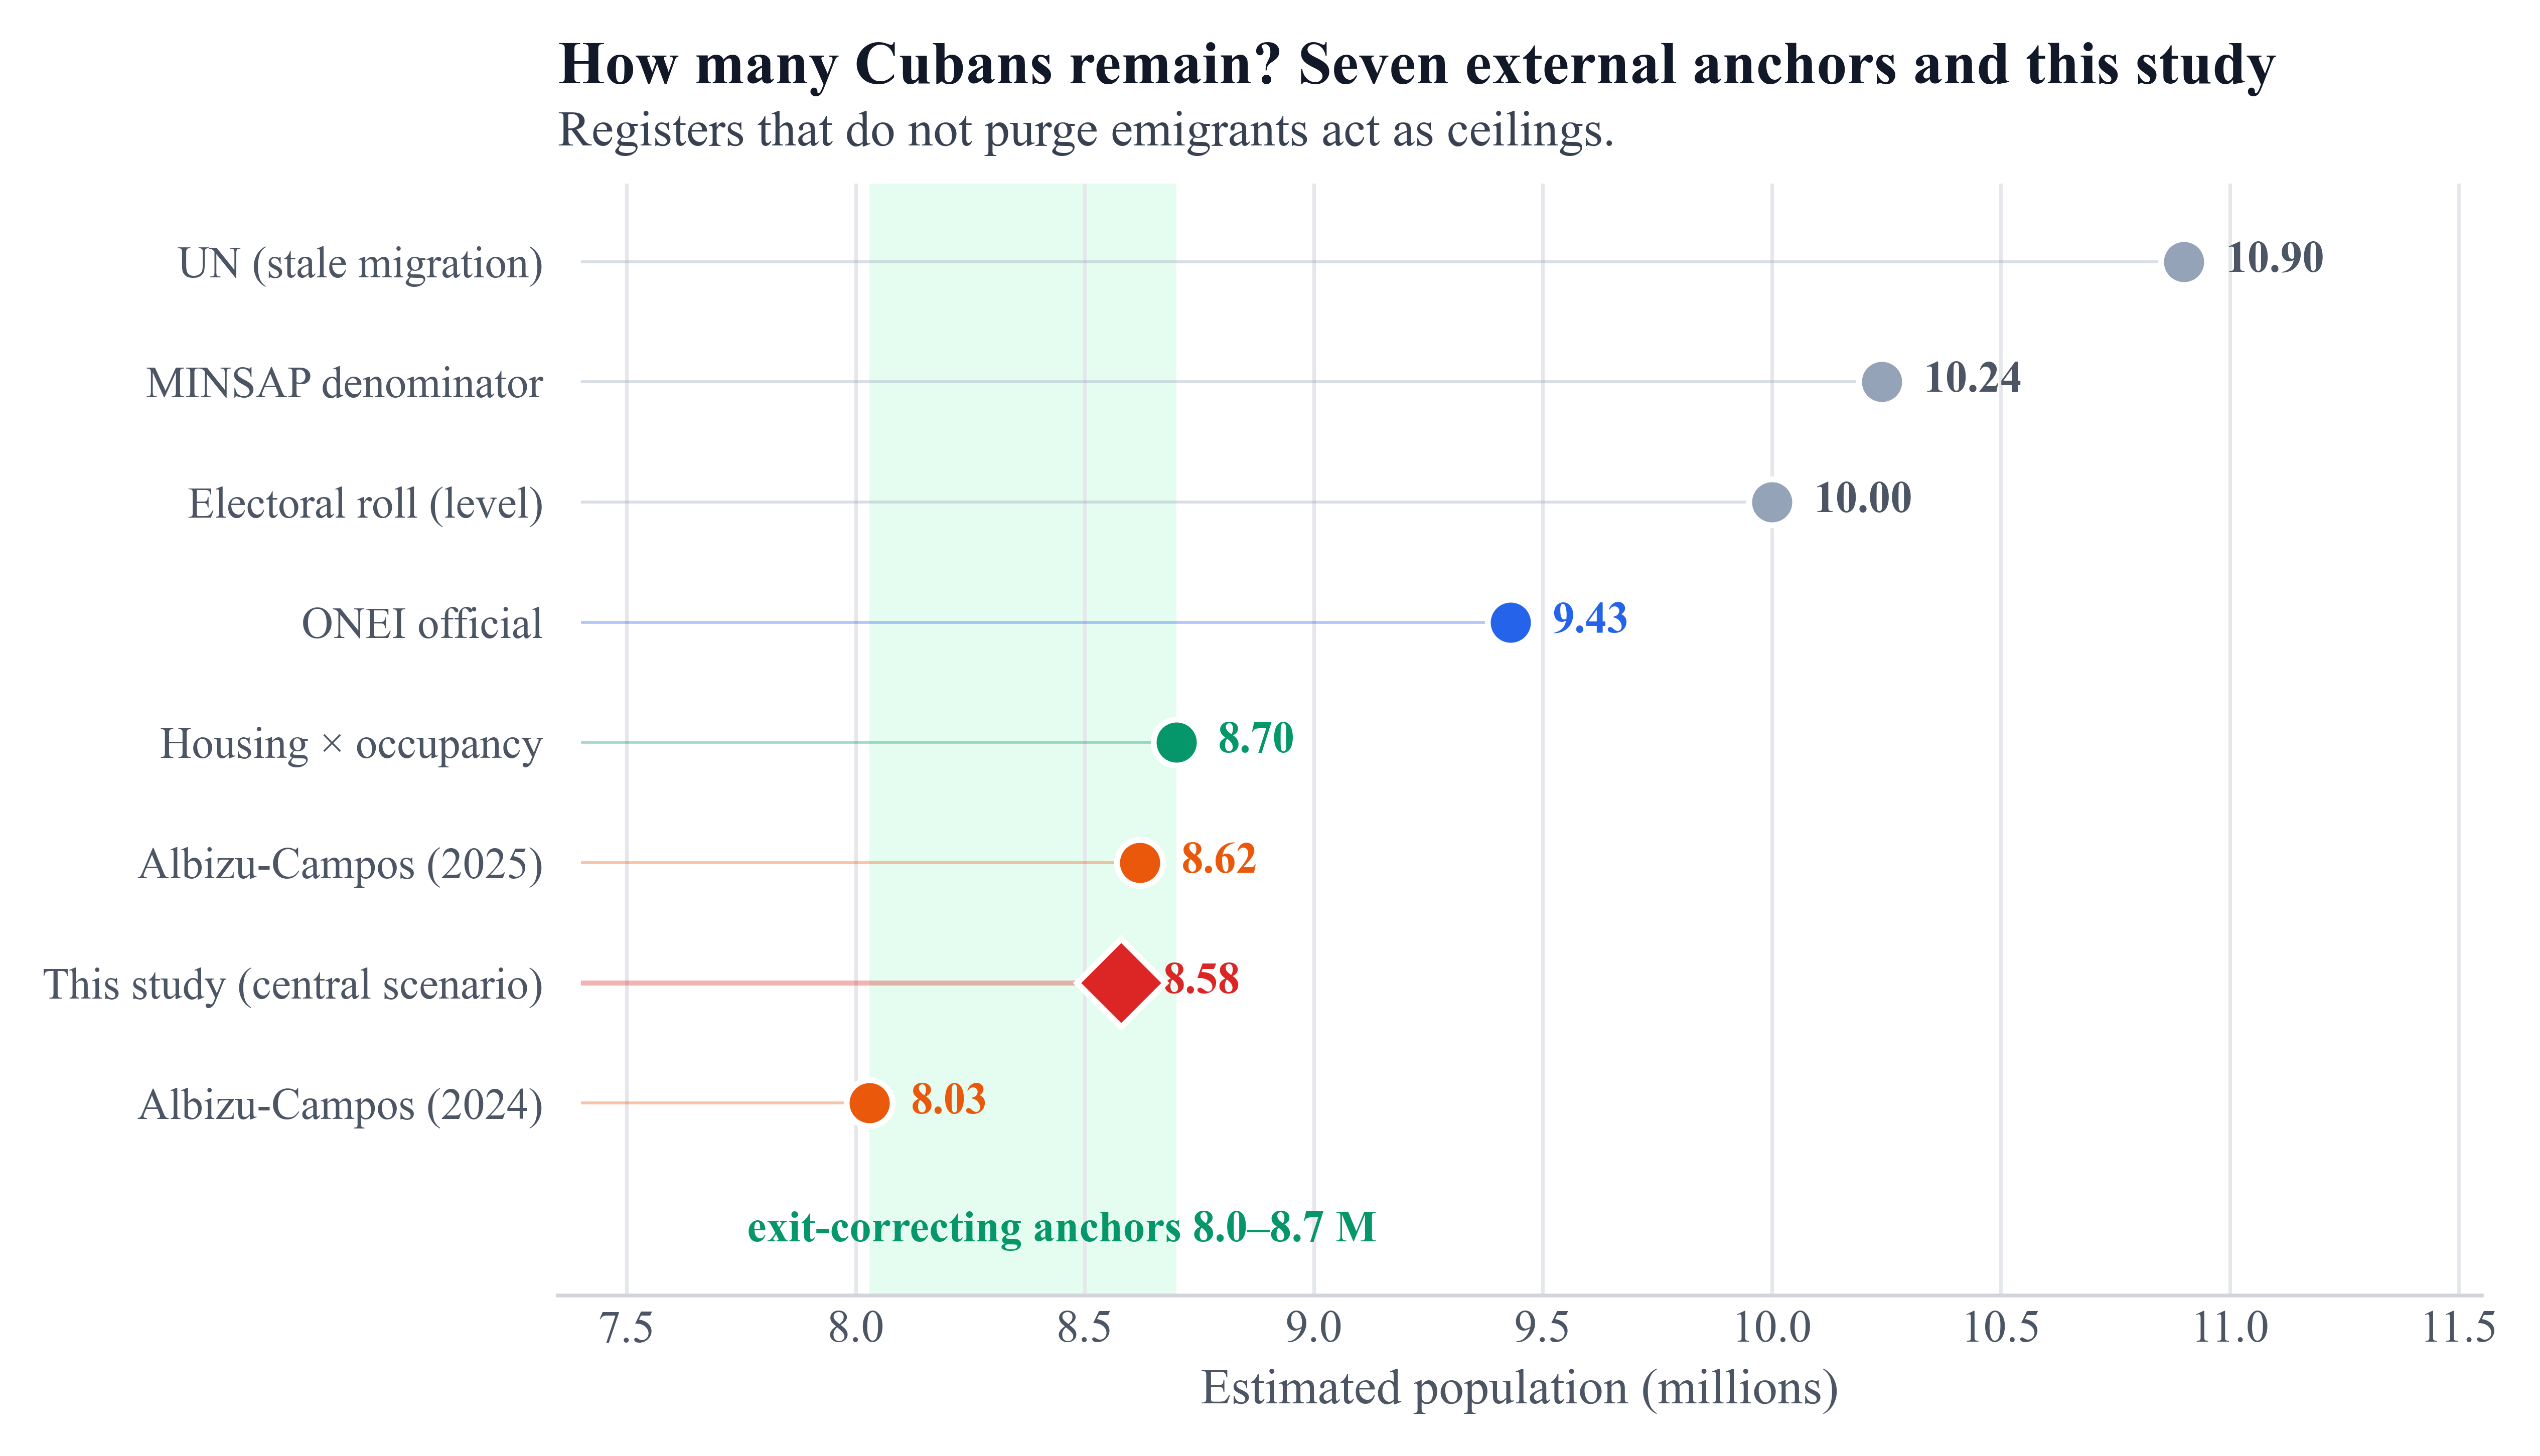
Eight independent registers. Sources that do not purge emigrants act as ceilings. Convergence sits in 8.0–8.9 M; central scenario (8.58 M) lies inside that band.
tri = pd.DataFrame(TRIANGULATION, columns=["Source", "Estimate (M)", "Role"])
tri
| Source | Estimate (M) | Role | |
|---|---|---|---|
| 0 | UN (stale migration) | 10.90 | ceiling |
| 1 | MINSAP denominator | 10.24 | ceiling |
| 2 | Electoral roll (level) | 10.00 | ceiling |
| 3 | ONEI official | 9.43 | official |
| 4 | Housing × occupancy | 8.70 | occupancy_fragile |
| 5 | Albizu-Campos (2025) | 8.62 | independent_shared_assumptions |
| 6 | This study (central scenario) | 8.58 | estimand_not_validator |
| 7 | Albizu-Campos (2024) | 8.03 | independent_shared_assumptions |
5. Excess mortality (age-standardized)
Crude death rates rose partly because the population aged. Applying 2019 age-specific mortality to the already-older population (Kitagawa-style counterfactual) still leaves about 50 thousand (32.6–67.5k) excess deaths in 2024–2025. Rates at ages 60+ are roughly +11–27% vs 2019.
6. Selectivity: who leaves, who stays
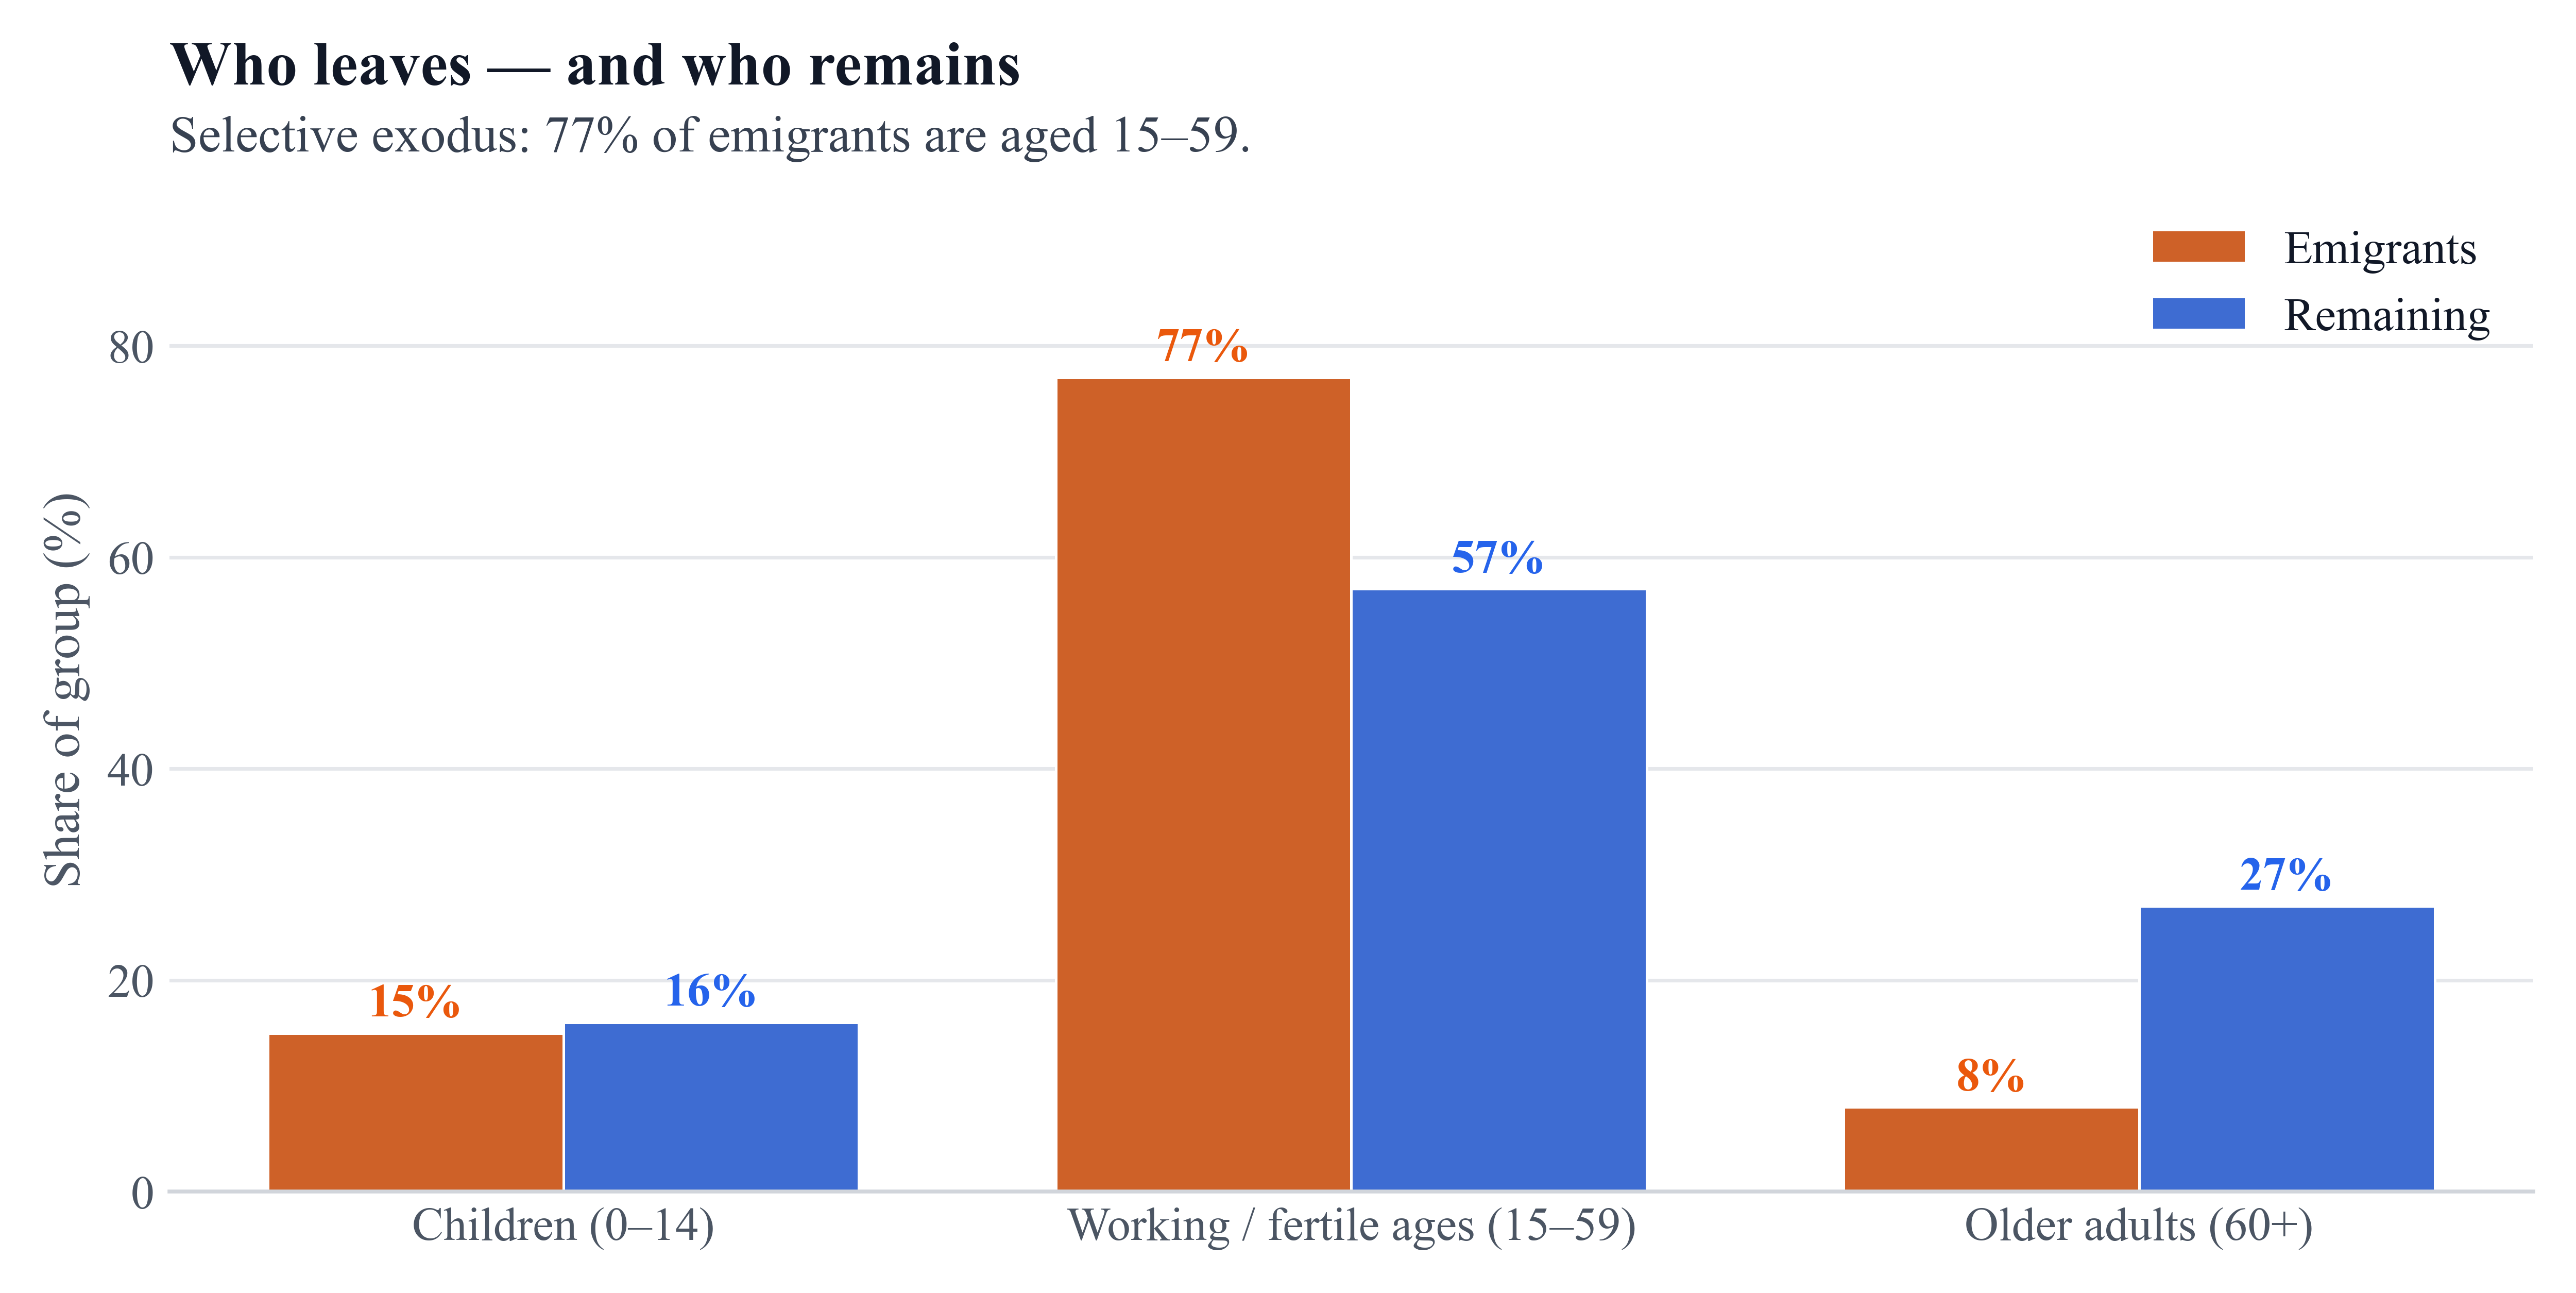
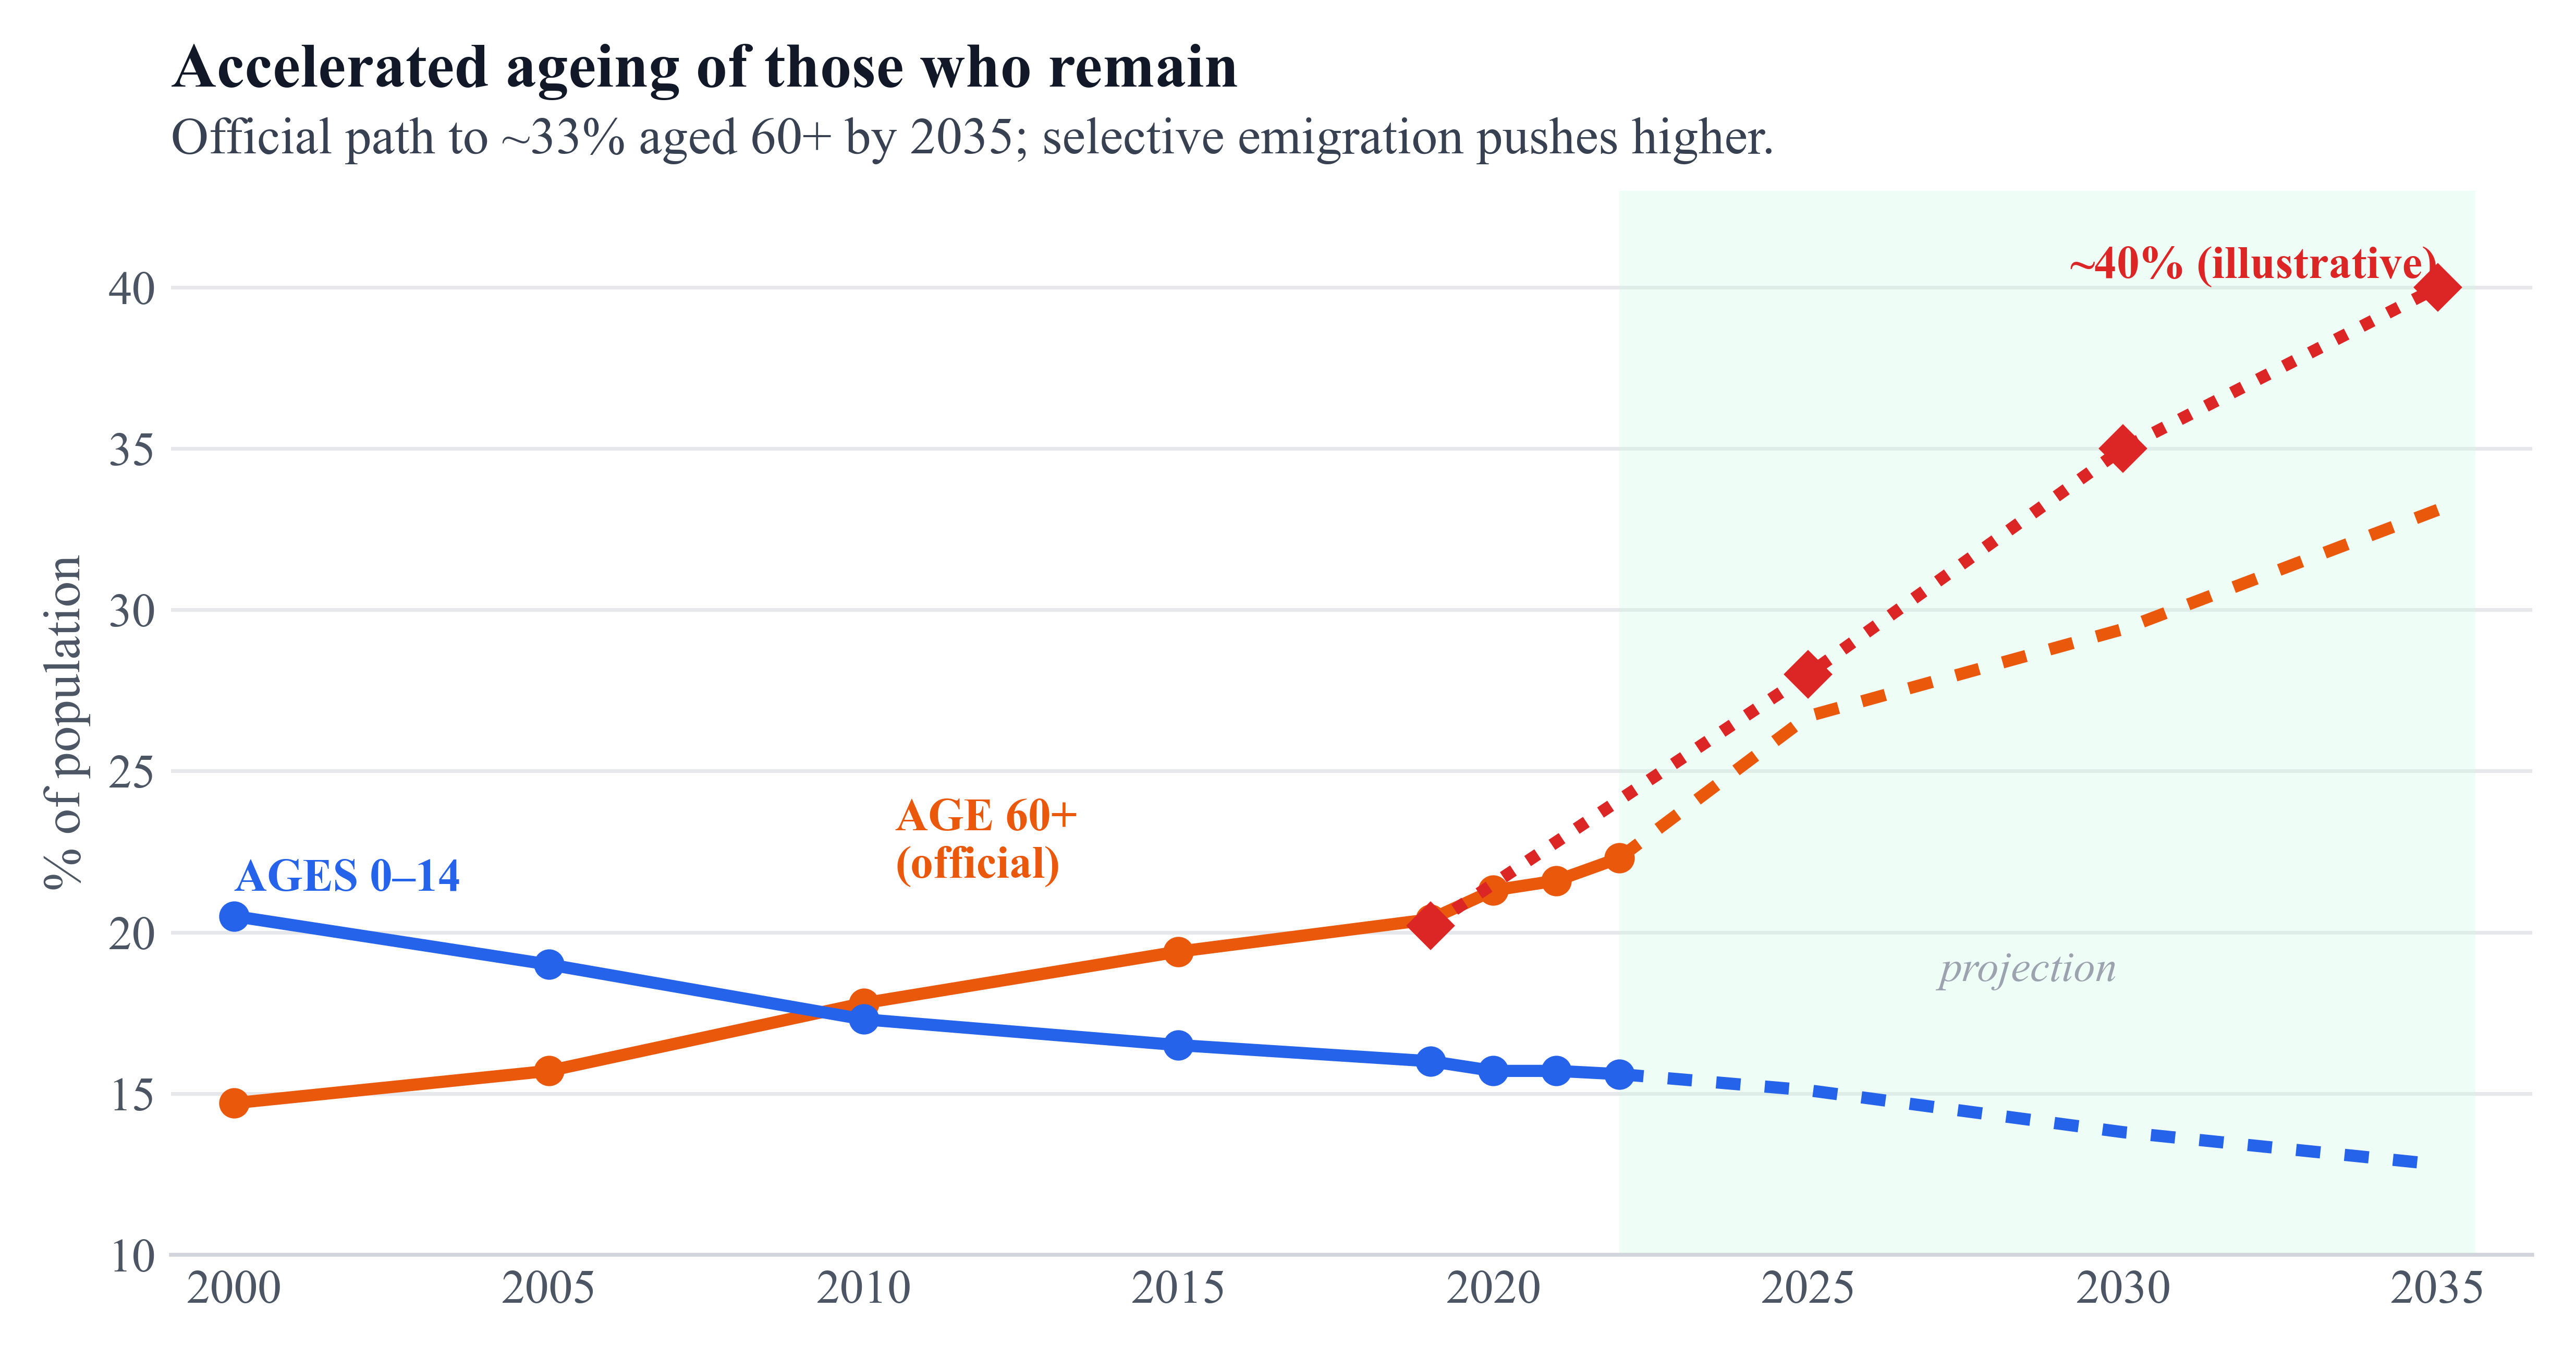
About 77% of emigrants are aged 15–59. Among those who remain, roughly 1 in 4 is 60+. Median age of leavers ~30 vs ~45 among stayers. Selective exit of women of reproductive age feeds the birth collapse:
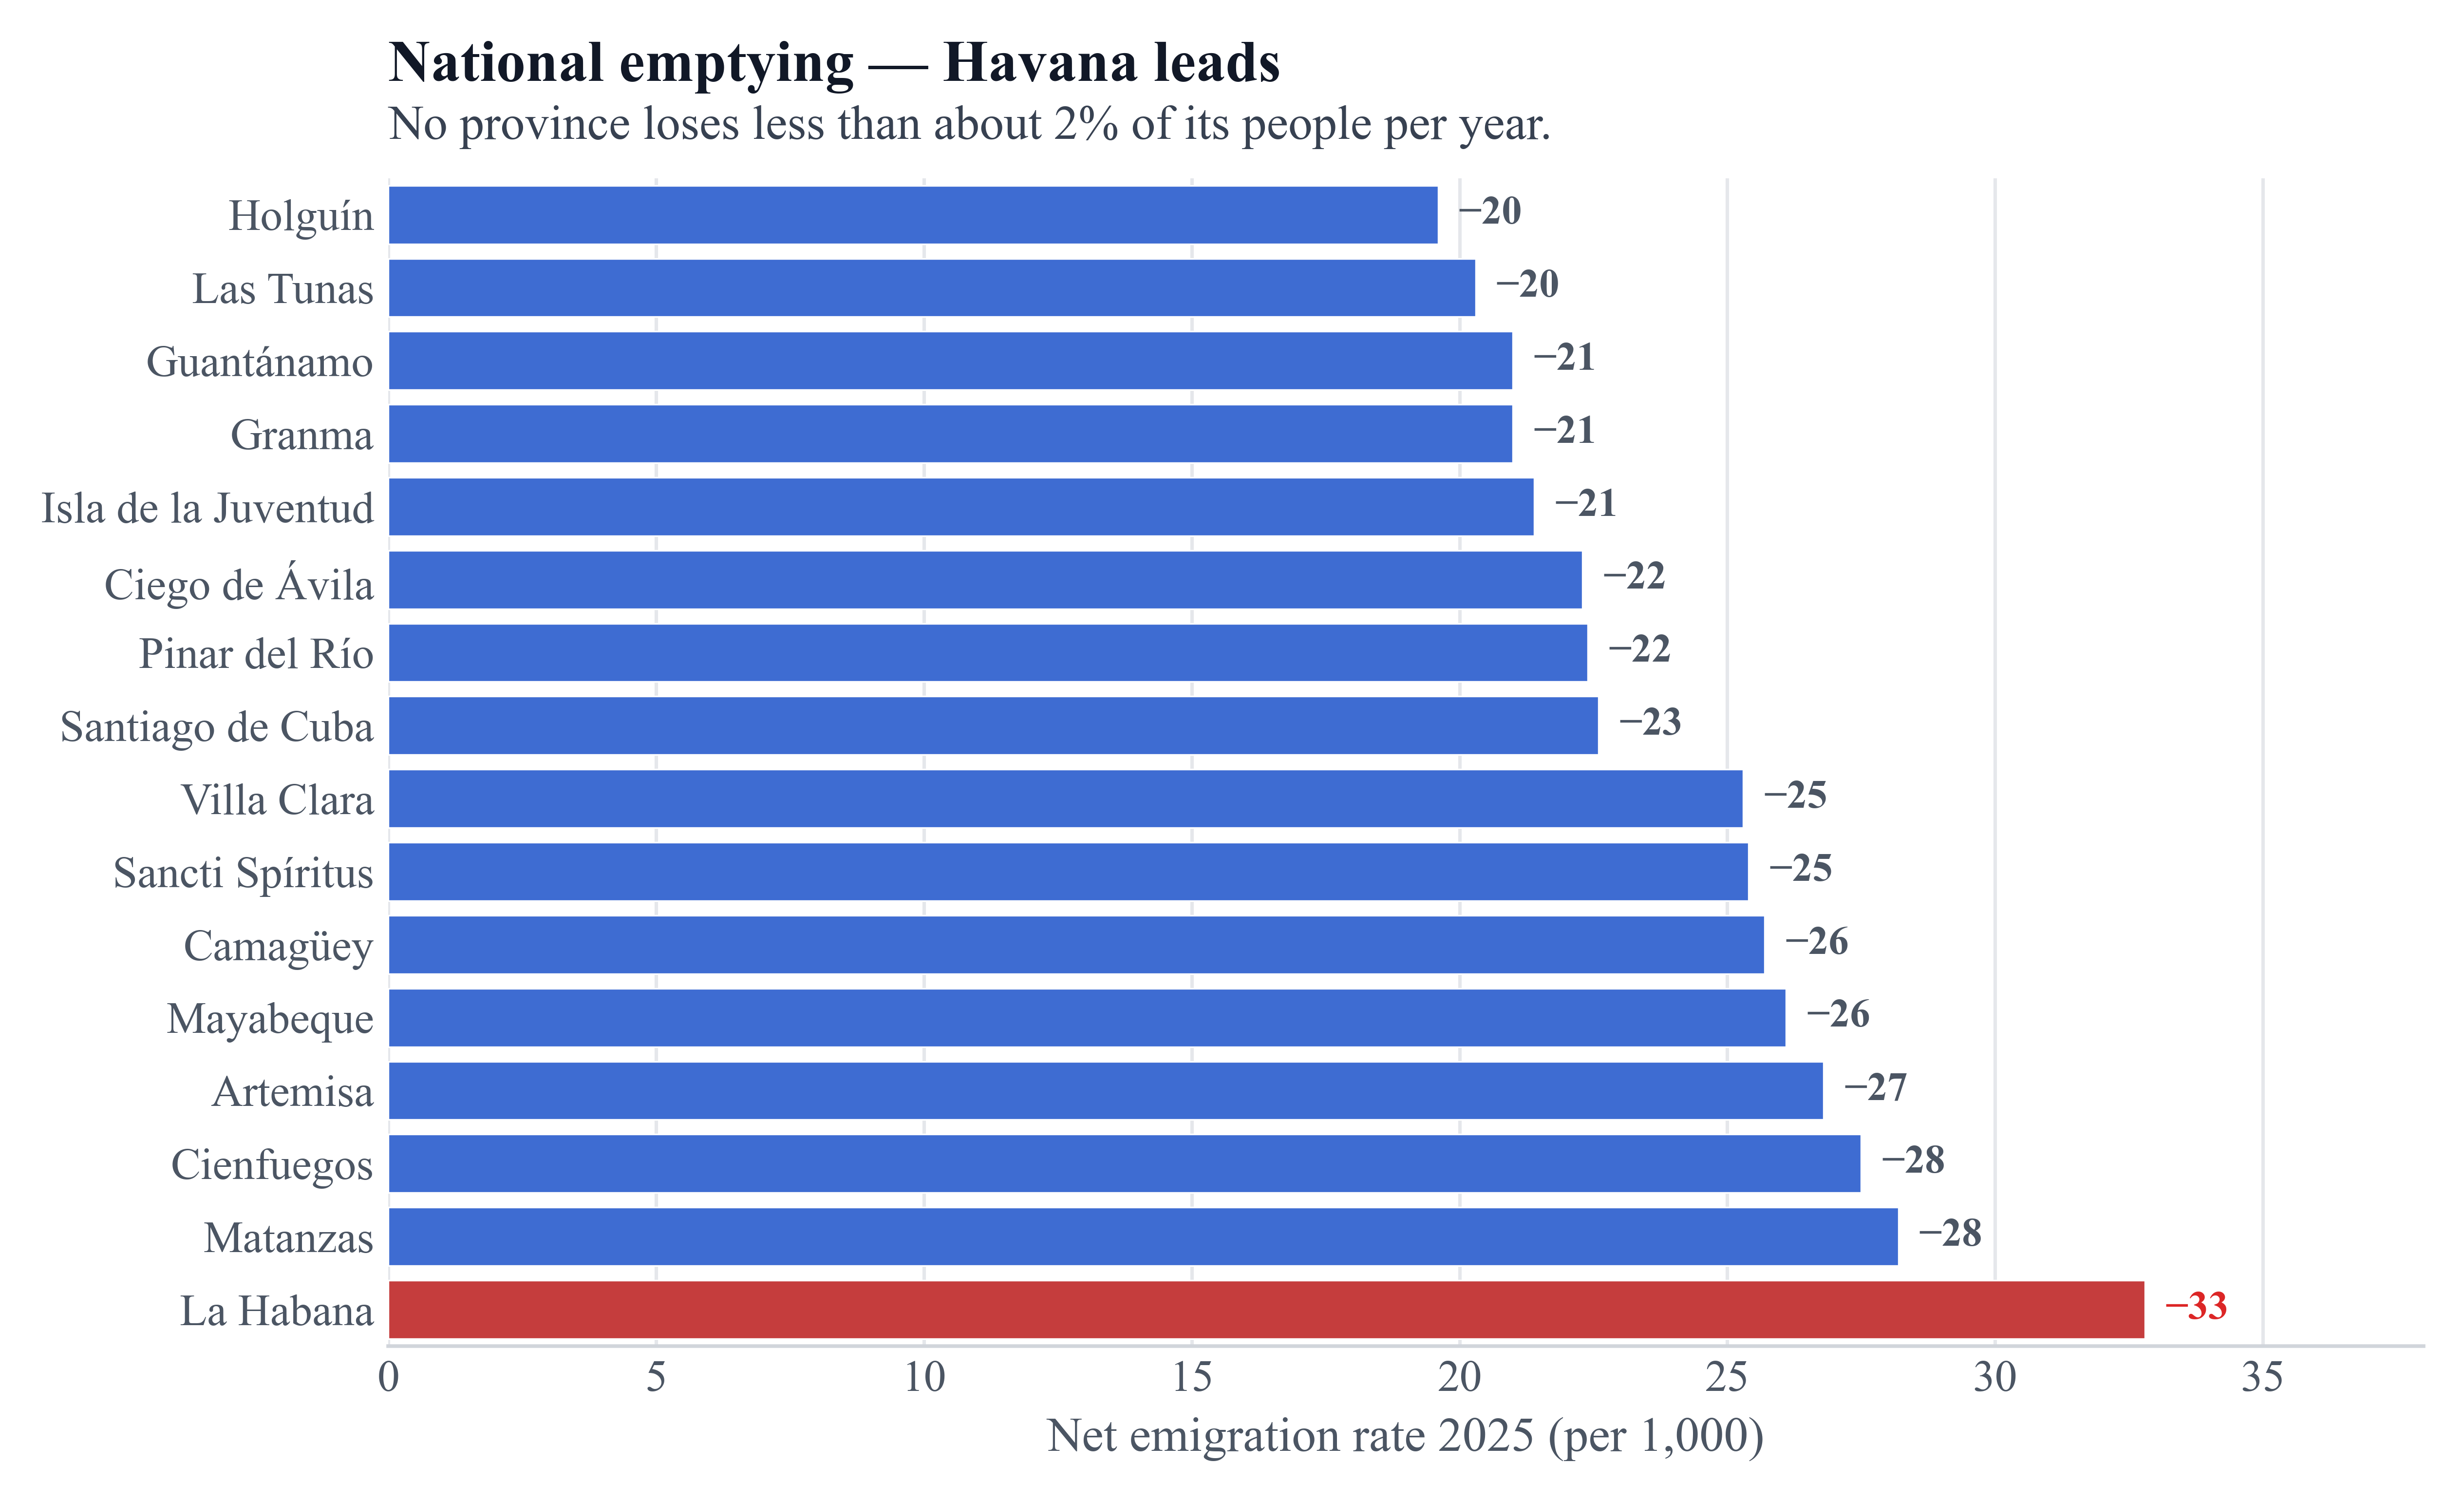
births ≈ women(15–49) × fertility, and the −38% birth drop decomposes roughly into (−21% women) × (−21% fertility). Emptying is national; Havana and the west move first.
7. Destinations ledger (settled only)
Summing settled migrants avoids double-counting transit: US ~800k · Spain ~130–135k · Uruguay ~35k · other ~80k → floor ≈1.05 M. ONEI net migration ≈1.52 M; models allow up to ≈2.0 M.
8. Projection through end-2026
If current flows persist, all four scenarios imply further loss of on the order of ~290k people in 2026, placing central scenario near ≈8.29 M by year-end (band roughly 8.02–8.84 M across models). Longer-run illustrative paths point toward ~7 M around 2030 under continued trends — a scenario, not a destiny.
9. Conclusions and limitations
- Dual engine: selective emigration plus collapsing births / elevated deaths / aging.
- Migration is the dominant term of the absolute loss; mortality matters humanly and demographically but is not the main headcount driver.
- Official statistics lag (~24-month emigration rule) and the missing census create structural uncertainty larger than within-model Monte Carlo noise.
- central scenario is preferred because the IMR sentinel validates registered death trends and focuses residual uncertainty on migration and triangulation.
Limitations: delayed census; incomplete destination microdata; elasticity calibration from analogs; housing-occupancy assumptions; English manuscript still expanding from this notebook spine.
Reproduce charts / models
pip install -r requirements.txt
cd scripts
python3 model_d.py
python3 charts_publication.py
python3 ig_charts.py
Data provenance: data/SOURCES.md. Literature PDFs: data/SOURCES.md.